
AI UI Design Prompt Generator (Google Stitch, v0, Figma Make)
Founders, product designers, PMs and developers who use Google Stitch, v0, Figma Make, Lovable or Bolt and want usable screens.

Prompt setAI Coding & Development Prompts
Turns a vague dashboard request into defined KPIs, a clear layout and build steps for your tool.
$9· one file, yours to keep
Yours to keep · instant download
Or all of them, $12/mo
KPI Dashboard Designer and 2,500+ other specialists, in your AI. Ask for any of them by name.
7 days free, then $12/mo · cancel anytime
One file
Every skill
30-day money-back · secure checkout by Stripe
================================================================================
  KISSMYSKILLS.COM
  AI KPI Dashboard Designer - Excel, Google Sheets, Looker Studio, Power BI
  Prompt Pack - Instant Use
================================================================================


WHAT YOU JUST BOUGHT
--------------------------------------------------------------------------------
A copy-paste prompt pack that turns "can you build us a dashboard?" into a
KPI dashboard people actually read. It works in two halves:
Design a weekly sales KPI dashboard in Excel for our sales director. Data: Sales table (OrderDate, Region, Rep, Revenue, Cost) and a Targets table by month and region.
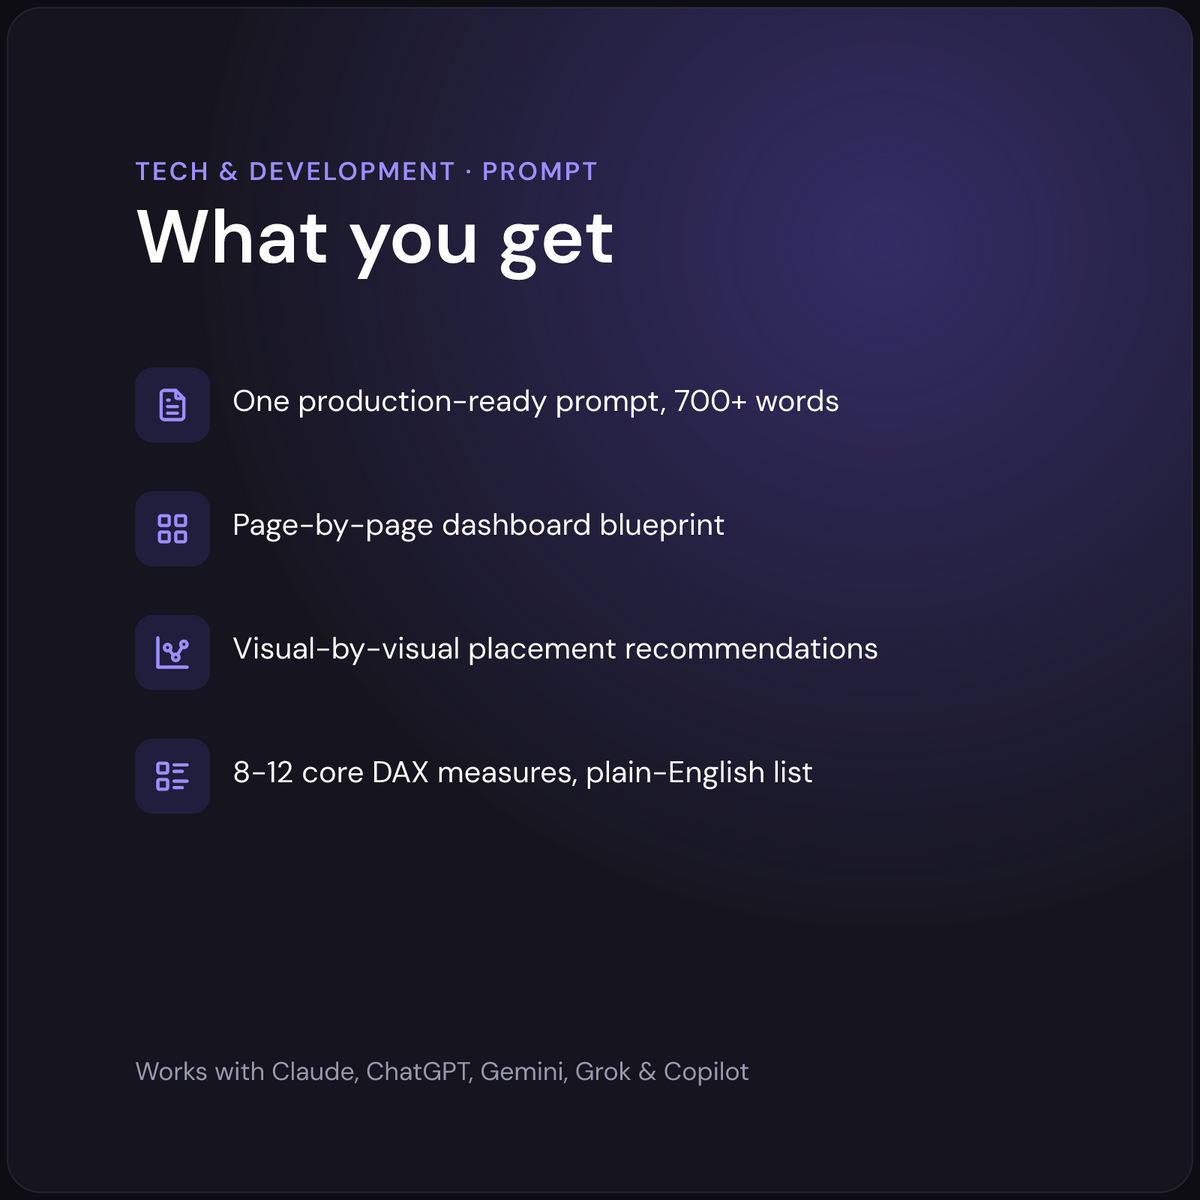
You get: up to 7 questions first (is revenue net of returns? what is a new customer?) → a north star (revenue vs target) plus supporting and leading KPIs → a definition table with formula, owner, source, refresh and target, gaps marked [... NEEDED] → a 12-column wireframe with KPI cards, trend and one breakdown → SUMIFS and XLOOKUP formulas, PivotTables and slicers → a validation checklist.
It is a prompt pack that designs a KPI dashboard with you and tells you how to build it. A master prompt and 28 ready-to-run prompts cover choosing a north star and supporting KPIs, writing metric definitions with formula, owner, source, refresh and target, laying out an executive dashboard, choosing charts, and building in Excel, Google Sheets, Looker Studio or Power BI, plus a prompt that reviews an existing dashboard.
Devika - Power BI Dashboard Consultant is a skill focused on Power BI projects. Taavi - Metrics & Semantic Layer Engineer builds governed metric definitions inside a data stack, and Isolde - SaaS Subscription Metrics & Revenue Analyst analyses MRR, churn and revenue. This pack is a tool-agnostic set of prompts for choosing KPIs, laying out the dashboard and building it in any of four common tools.
Yes, as far as you share it. You paste your column names and a few sample rows, and the prompts write formulas, QUERY statements or DAX measures that use those names. Nothing connects to your data automatically, and the AI is told never to invent numbers, targets or columns; anything missing is marked [... NEEDED].
Any capable AI chat works: ChatGPT, Claude, Gemini or Copilot. The prompts are plain text. You still build the dashboard yourself in Excel, Google Sheets, Looker Studio or Power BI; the AI gives the design, the formulas and the step-by-step instructions, and the validation prompt helps you check every number.
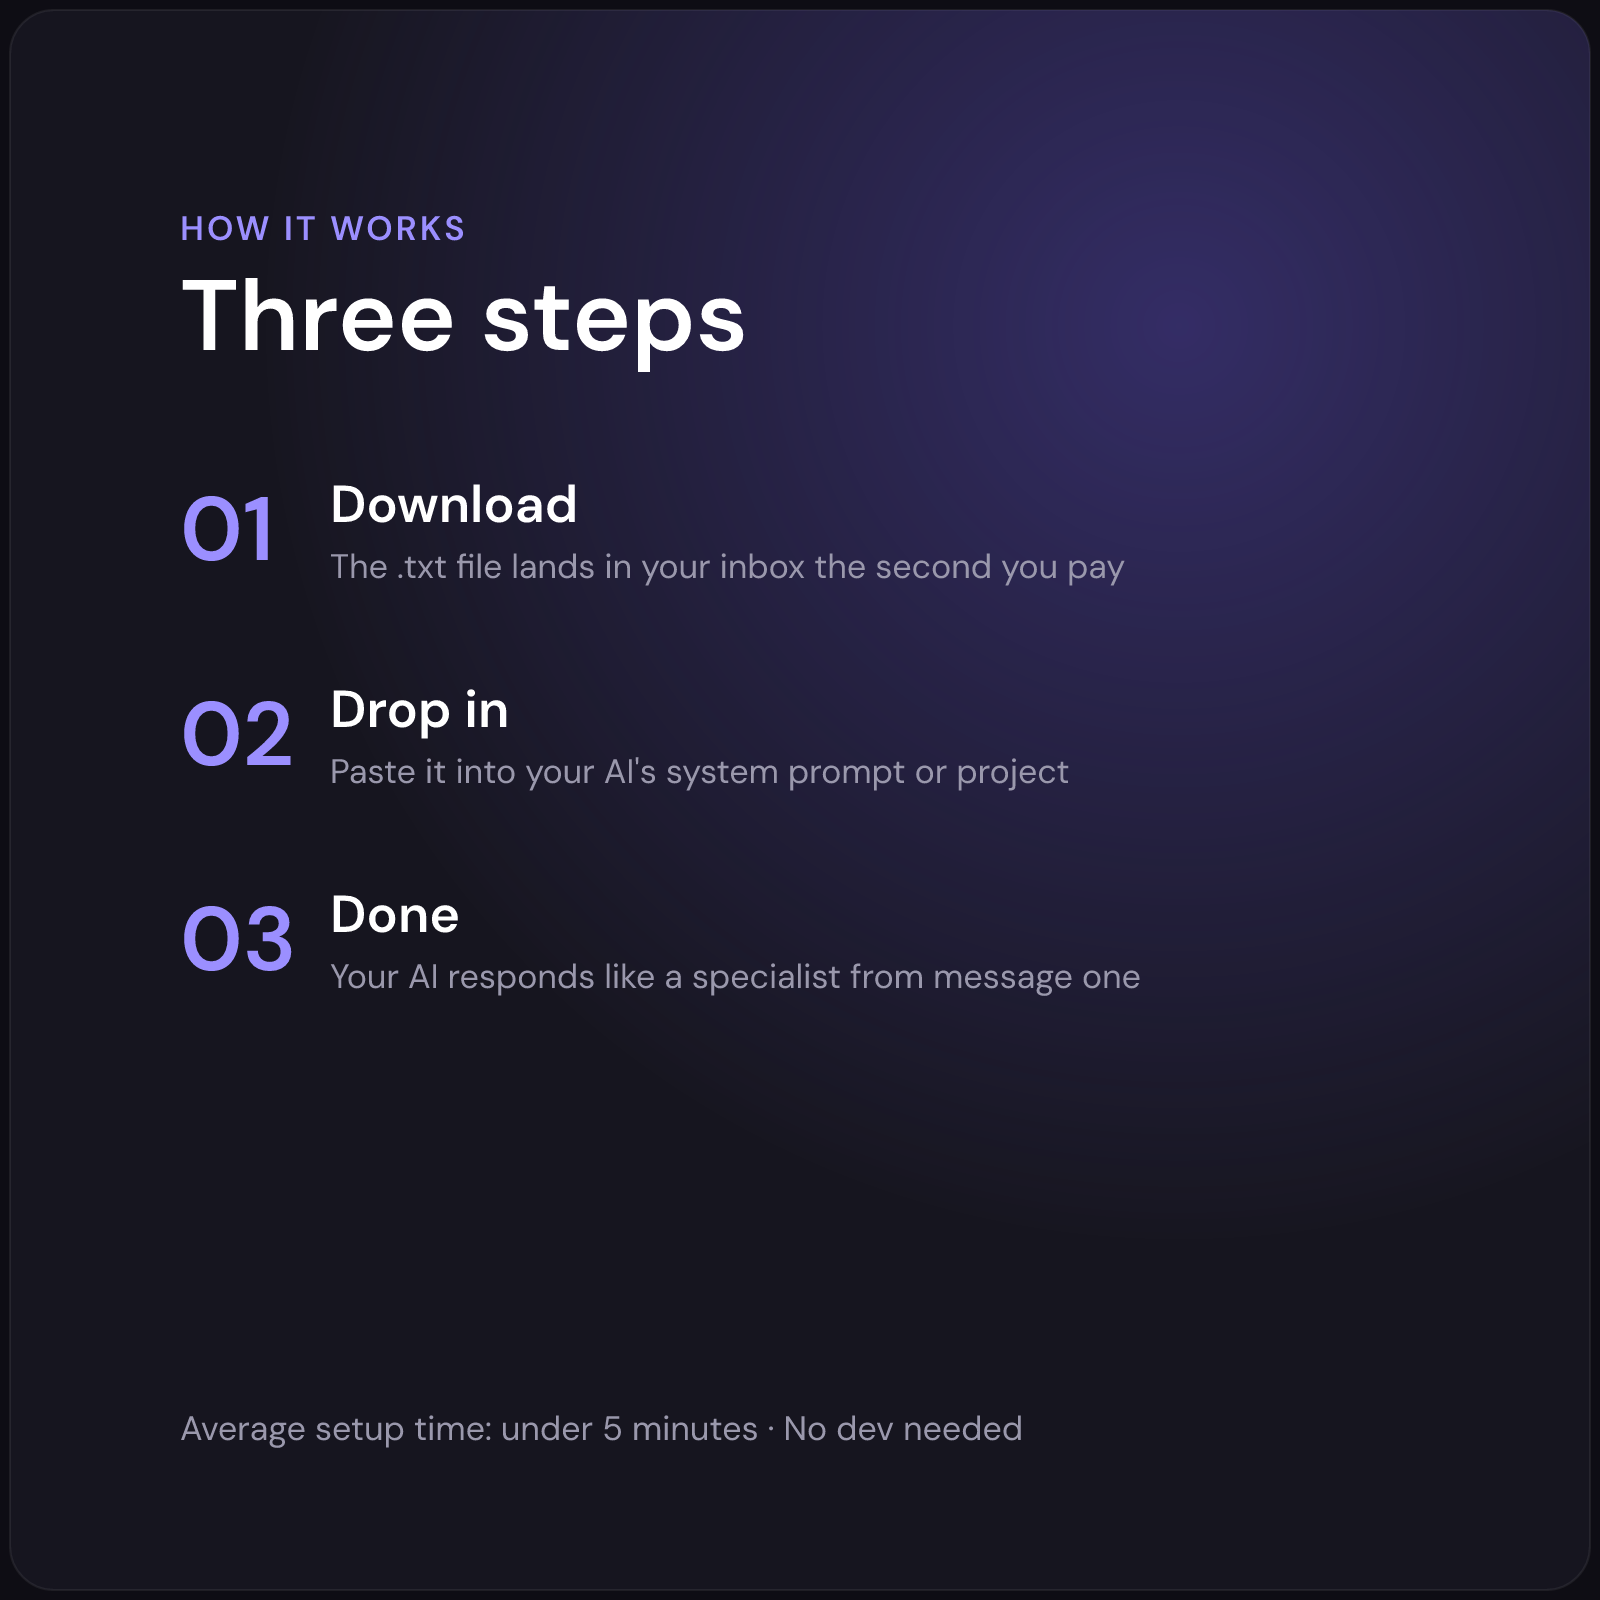
Download your .skill file from the order email or your account. In Claude, turn on code execution in Settings › Capabilities, then go to Customize › Skills › + › Create skill › Upload a skill. Start a new chat and ask for the specialist by name.
Founders, product designers, PMs and developers who use Google Stitch, v0, Figma Make, Lovable or Bolt and want usable screens.
Non-developers who need to understand code, students learning to program, and developers reading an unfamiliar codebase or language.
40 Reasoning Prompts for DeepThink, Coding and Math
Microsoft 365 & GitHub Copilot Prompts for Word, Excel, Outlook, Teams and Code